

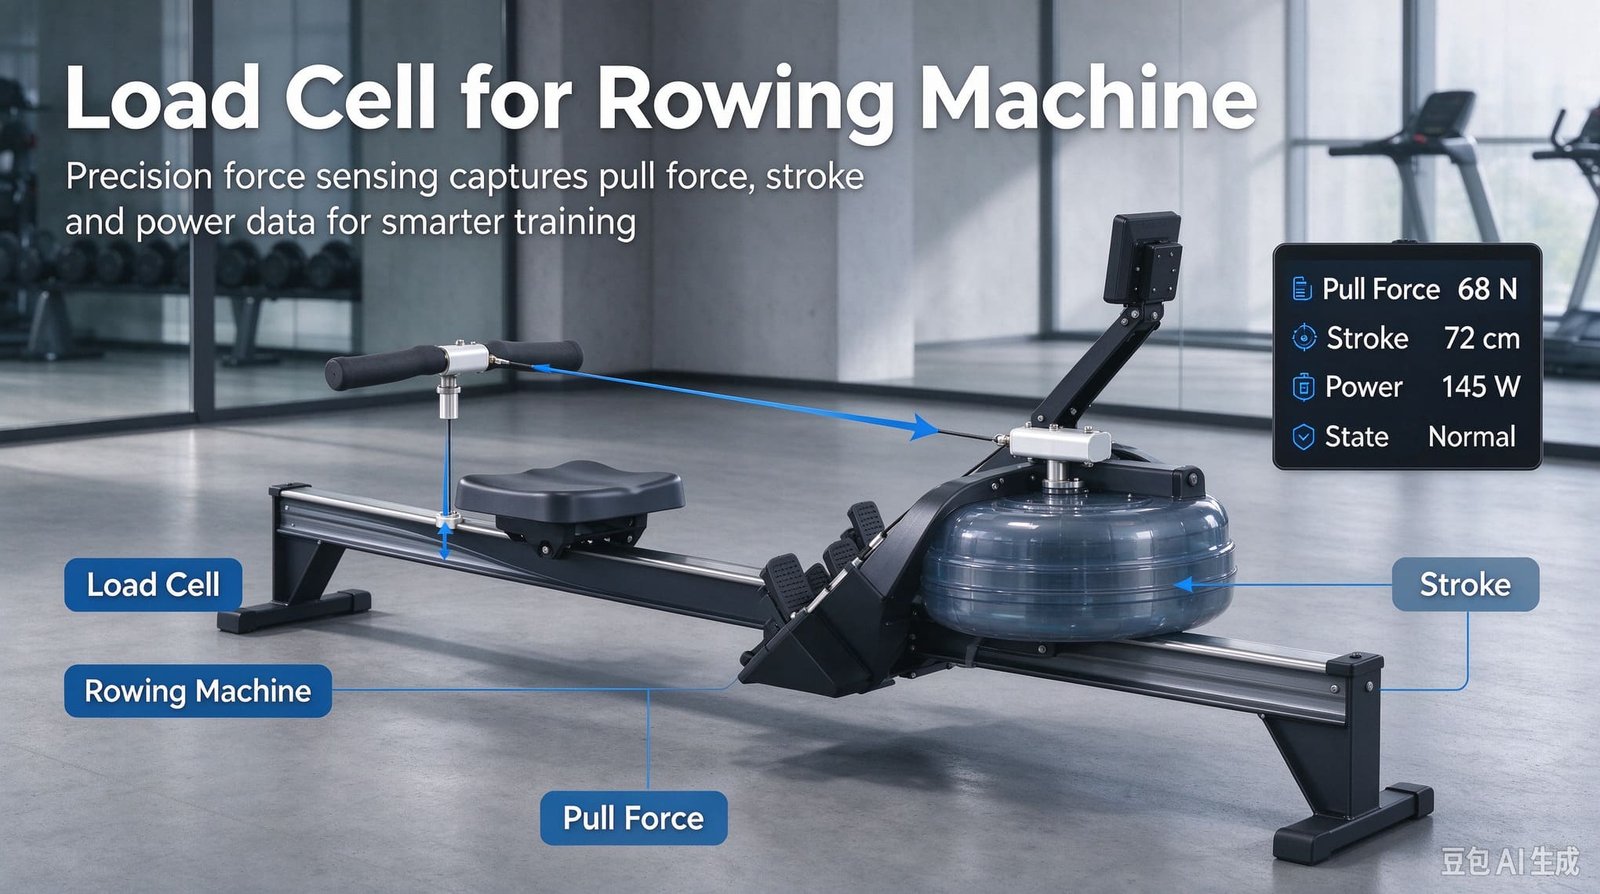
Load Cells for Rowing Machines: Field Notes From Putting a Load Pin in the Chain Path
📅 October 7, 2026
⏱️ 17 min read
🚣 Connected Fitness & Sports Engineering
A rowing machine is the only cardio machine that can tell you the truth about force — and most of them don’t measure it. For forty years the industry has been inferring power from what happens to a flywheel, and it has been doing that remarkably well. But a new edition of the international safety standard added a test for power-display accuracy, connected rowers now have to publish numbers that apps and virtual racing platforms will compare against each other, and suddenly “good enough for a home display” is not the same as “defensible”. That is the gap this article lives in.
What follows is how I specify force sensing for rowers now, after quoting into a chained connected rower for a Dutch OEM, a university biomechanics retrofit where I talked part of the job out of my own quotation, and a commercial-gym rollout that taught me the hard way that the failure mode nobody budgets for is cycle count. It covers where you physically put the sensor, how to size it from two numbers instead of a hunch, why resolution is the one specification that needs no discussion at all, how fast you must sample before the force curve starts lying, and the eight questions I ask before I can quote anything — because on this application the answer is a machined part, not a catalogue part.
I’m Robin from VektorForce. We supply load cells, load pins, force sensors, transmitters, junction boxes and indicators — the sensing layer of a weighing or force-measurement system. We don’t build rowing machines, we don’t write your power algorithm or your calorie formula, and we don’t certify your machine to a fitness-equipment safety standard. Where exactly that line falls is the subject of section 11.
1. The 2024 standard change that put force sensing on the rowing agenda
Rowing machines are governed by the ISO 20957 series of stationary training equipment standards. The part that matters here is ISO 20957-7, “Stationary training equipment — Part 7: Rowing equipment — Additional specific safety requirements and test methods”, which is written to be read alongside ISO 20957-1. It classifies machines two ways: usage classes H (home), S (studio / commercial) and I (inclusive use), and accuracy classes A (high), B (medium) and C (low) where training data are displayed.
The third edition — ISO 20957-7:2024, published September 2024 — replaced the 2020 edition, and one of the stated changes matters enormously to anyone designing the electronics: requirements on display and power accuracy testing were added. There is now a clause (6.9) covering “Testing of accuracy of the power readouts”, split between equipment using a speed-independent resistance system and equipment using a speed-dependent one. If you want to claim an accuracy class on the label of a rower that displays watts, there is a defined test for whether those watts are real.
Two other numbers from that document are the most useful I have found anywhere for sizing a sensor in this application, and almost nobody outside testing labs quotes them:
| ISO 20957-7 requirement | Value | What it means if you put a sensor in that load path |
|---|---|---|
| Ropes, belts, chains and their attachment components (static load, §5.5 / test §6.1.6) | (2 100 ± 30) N | A load pin replacing a chain anchor pin is an attachment component. It has to survive this proof load without permanent damage. This one number sizes every pin I quote. |
| Intrinsic loading (§5.3 / test §6.4) | 2.5 × maximum user body mass ±5%, or 2 500 N, whichever is greater | This applies to the frame and its load-bearing structure. It tells you what the chassis around your sensor must absorb, and therefore what your sensor’s neighbours will do to it during the test. |
| Foot strap pull (§5.6) | ≥ 500 N perpendicular, held ≥ 1 min | Relevant if you ever want to instrument the stretcher rather than the handle. |
| Seat retention (§5.2.4 / test §6.2) | ≥ 100 N in any direction, ≥ 1 min | Small number, but it tells you the seat rail is a legitimate light-force measurement point. |
| Accuracy of the power readouts (§6.9) — new in the 2024 edition | Test method added; accuracy classes A / B / C defined | If your displayed watts are derived from a strain measurement, your entire measurement chain is now testable evidence, not marketing copy. |
The market context explains why any of this is worth arguing about. One research house sizes the rower machine market at USD 1.61 billion in 2025, USD 1.71 billion in 2026 and USD 2.71 billion by 2032, at a 7.69% CAGR. A second puts the rowers market at USD 850 million in 2026 growing to USD 1.32 billion by 2033 at 6.5%. A third describes a global indoor rower market of roughly USD 1.40 billion in 2026 at about 7.9%. Those numbers differ by a factor of two because “rowing machine” means imported units in one estimate and retail revenue in another, and because some count only the hardware while others include the subscription attached to it.
The short version, if you only read one paragraph:
- Today most rowers don’t measure force at all — they infer it from flywheel behaviour. That works, until someone tests the number on the screen.
- If you do measure directly, put the sensor in the chain or anchor path, size it around the 2 100 N chain-component proof load, and expect the part to be machined to your drawing.
- Resolution is free. Even a 5 kN pin on a modest 24-bit front end resolves well under 0.2 N, which is invisible against a 0–1 350 N force curve. Stop optimising it.
- You do need bandwidth. Published rowing biomechanics records handle force at 150–200 Hz for a reason: below that, the recorded peak drift and the curve shape degrades.
- You oversize the sensor for fatigue life, not for accuracy. A boutique studio generates about 3.2 million load cycles per year per machine, which is the specification nobody puts on the drawing.
Everything below comes from the supply side. I sit between an OEM’s engineering team and a workshop in Xi’an, and most of my job is turning “we need the watts to be defensible” into a diameter, a length, a rated load, a fit tolerance and a cable exit direction.
2. Two ways to get watts: infer it from the flywheel, or measure force directly
Every rowing machine that displays power does so by one of two routes, and the difference decides whether you need a sensor at all.
Route one: infer it from what happens to the flywheel
This is the dominant approach and it is genuinely elegant. The rower pulls the handle, the chain spins a flywheel against resistance, and then stops pulling. Between strokes nothing drives the flywheel, so its deceleration can be observed. That deceleration gives a drag factor, and combining the drag factor with the flywheel’s rotational inertia gives the work delivered on each stroke. Divide by the stroke duration and you have power.
Concept2 built a worldwide ranking system on this. The machine is self-calibrating: the drag factor is re-derived on every recovery phase, so results are comparable between two different ergs, in different countries, with different dust accumulation. Independent testing has generally found it excellent — one long-term field comparison measured the PM5 within about 1.2% of an on-water power meter at steady-state pace.
And here is the part that surprises rowing people: even the machines most associated with the force curve typically derive it indirectly. RP3 Rowing’s own app documentation describes the force curve like this — it is “the real time visualisation of your stroke providing a curve that represents the acceleration of the flywheel“, plotted with force in newtons on the Y axis and length in centimetres on the X axis. The curve is real, it is genuinely useful for coaching, and it is derived from kinematics.
The limitations of the indirect route are known and published. The reference-system comparison by Treff and colleagues put a Concept2 PM5 against a force-and-displacement instrumented rig and produced Bland-Altman plots of the percentage difference in mechanical power across eight rowing conditions — steady rowing at defined stroke rates, and deliberately unsteady rowing with alternating stroke force and rate. Older work (Boyas et al., 2006) reported average underestimation on the order of 25 W. The sources of error are structural rather than sloppy: there is no previous recovery phase at stroke #1, so the monitor assumes a default drag factor; the energy stored in the flywheel after the drive ends is not attributed; and during unsteady rowing the divergence grows. None of this matters for training consistency. It matters very much once you are being tested against a class requirement.
Route two: measure force and multiply
Physics gives a cleaner definition. Mechanical power applied at the handle is force times velocity, so if you measure both directly you measure power directly, with no flywheel model in the middle.
This is what the aftermarket does. SmartRow, the Dutch power-meter company, builds exactly this — their pitch is that because they measure force and displacement at the handle rather than modelling a flywheel, readings are unaffected by the rowing machine’s brand, wear, or how tight the bungee happens to be. They measure handle force, detect chain displacement (publicly described as a “Polygon Effect” that reads the chain links passing over the sprocket), combine them into power, and broadcast it over standard Bluetooth fitness protocols so it can be used in third-party apps. They report compatibility with more than 50 rowing machine brands and a community of 50 000+ users across 43 countries. That cross-brand independence is the entire commercial argument for putting hardware in the handle, and it is a good one.
Production machines that go this way gain three things: the power figure no longer depends on a model of the drivetrain, it no longer drifts as bearings wear, and you get the force curve as a genuine measurement rather than a reconstruction. They pay for it with hardware in the load path, a cable that moves, and an electronics channel that has to sample fast enough. That last part is where I spend most of my time with customers.
A note on who this article is for. If you are building a rower whose numbers only need to be internally consistent, buy neither solution and improve your flywheel model. If you are building one that has to publish defensible watts to third-party apps and pass a power-accuracy clause, you are looking at route two — and the rest of this article is about buying the first stage of that chain properly.
3. Five places to put a force sensor in a rowing machine
Before any specification, someone has to decide what physical quantity the machine is actually going to measure. There are five sensible attachment points, and the choice is mostly about what you are willing to include in the measurement.
| Measurement point | What it actually measures | Why choose it | What will bite you |
|---|---|---|---|
| Inline in the handle cord / chain | Exactly what the athlete produces | Excludes all drivetrain losses, so numbers compare across machines and across brands — the whole argument for handle-mounted power meters | The cable moves every stroke; the load angle changes through the drive; it is in the athlete’s hands, so it gets dropped and swung |
| Chain anchor / frame-end pin | Handle force plus bearings, sprocket and strap friction | Fixed geometry, no moving cable, mechanically robust, cheap to make stiff — the default answer for production rowers | Drivetrain losses ride on the signal. Stable enough to calibrate out, but they will drift as bearings age |
| Flywheel axle as a load pin | Reaction force at the axle supports | Very stiff, very compact, replaces an existing shaft | Bearing preload and pulley-side moments contaminate it; needs real accommodation design, not a catalogue swap |
| Foot stretcher plate | Leg-drive force, separately from the handle | Splits the contribution of legs vs back vs arms — the reason research rigs instrument both ends | Two channels minimum (left/right), usually 3-axis, requires either two matched cells or genuine multi-axis hardware |
| Seat rail | Body-mass transfer during the stroke | Useful diagnostic for technique; light forces, so cheap sensors | Poor proxy for power. Published work notes that losses at the seat are minimal, which is another way of saying it doesn’t tell you much |
The research literature has already made this choice for us, which is the most efficient way to settle the argument. A 2025 study estimating rowing forces with machine learning equipped an RP3 ergometer with force sensors at the feet and at the handle plus displacement sensors at the handle, seat and chest, digitised at 150 Hz. A study of stroke rate and rowing technique instrumented the handle with an inline load cell between handle and cord alongside Kistler force plates under the stretchers and under the machine itself, sampling force at 200 Hz. Decades earlier, the classic Hartmann work used a strain gauge for handle force and ultrasound for velocity on a Gjessing ergometer.
Put simply: handle force and stretcher force are the two channels worth buying. Everything else is a service diagnostic.
4. Case 1: the Dutch OEM whose drawing had an S-type cell in a moving cord
In early 2024 a rowing machine manufacturer in the Netherlands came to me with an upgrade programme. They had a well-regarded home rower and were adding electronics: a control board, a BLE radio, an app, and enough sensing to publish real wattage. Their engineering drawing showed a load cell in the handle cord — specifically an S-type tension cell between two clevises, inline in the cord, about 200 mm from the handle.
It was a defensible sketch. It is what the aftermarket handle meters do, and it gives the cleanest possible answer about what the athlete produced. But when I asked for the rest of the picture, four things did not hold up.
First, the cord swings. Through a drive phase the handle moves through maybe 750–900 mm of travel and, critically, its angle relative to the machine changes as it does. An S-type cell has one axis it wants to be loaded along. If the load comes in at an angle θ, the cell reads F·cos θ and the missing part simply disappears. At 10° that is 1.5% low; at 15°, 3.4% low. It is not a fixed offset you can trim — it is a stroke-shaped error that is worst exactly where the force is highest, so it flattens the peak and distorts the curve you are trying to sell.
Second, two clevises and the cell occupy maybe 90 mm of linear length. The rower’s chain path has almost no slack. Adding that much inline hardware changes the catch geometry and therefore changes the stroke the customer bought.
Third — and this is what killed it — the cable moves. In this design both ends of the cell move every single stroke, which means the cable flexes every single stroke, tens of thousands of times a week, in a machine that will be sold with a five-year warranty. In my experience the cable, not the strain gauge, is the first thing to die in any dynamic installation.
Fourth, they were a volume manufacturer. A clevis-and-cell assembly is a lot of machined hardware for one home rower.
What we did instead
We moved the measurement to the frame end and made the sensor disappear into a part that already existed. The machine already had a hardened steel pin joining the chain anchor to the frame; we quoted a version of our shaft-pin load cell machined to the same envelope, so nothing in the machine’s geometry changed at all. There was no new bracket, no added length in the chain path, and no moving cable.
The specification we settled on after three rounds of drawings:
- Envelope: matched to their existing pin — same nominal diameter and length, so it dropped into the same bore and retained clearance
- Capacity: 3 kN, chosen rather than guessed (the arithmetic is in section 5)
- Output: 2.0 mV/V four-wire, going into their own front end, not ours
- Cable: shielded, exiting radially through a strain-relief boot, 1 m to their board
- Rotation: a keeper plate on their side to stop the pin turning in the bore
- Sealing: IP68 — not because rowers get wet, but because sweat dries to salt and this is a machine that lives in a garage
What went wrong, and what it taught me
The first prototypes read 2.8% low against their reference instrument. Nothing about the sensor was defective. Their supplier had bored the housing to a generic clearance fit, so the pin could rock slightly in it, and every stroke cocked it a few fractions of a degree before the load built up. Instead of loading pure shear along its marked axis, it was picking up a bending component — and the amount of bending depended on where in the stroke you were, which is the same shape-of-error problem we had just escaped by leaving the cord.
The fix took two small changes: reaming the bore to an H7/g6 fit class, and actually fitting the keeper plate that had been specified but not drawn. Both errors vanished.
That project also set the structure I use for every rowing enquiry since — the eight questions in section 10, which I now send out before quoting rather than after.
5. Size the range from two numbers, not from how strong rowers are
“Rowers pull very hard” is not a specification. Fortunately this application has unusually good published data, and unusually bright lines in the standard.
Number one: what people actually produce
The benchmark study is Hartmann and colleagues, who instrumented a Gjessing rowing ergometer with a strain gauge and recorded peak force, velocity and power in world-class rowers. For A-squad men the maximum peak force was 1 350 N, peak velocity 3.80 m/s, peak power 3 230 W. For women the corresponding figures were 1 020 N, 2.90 m/s and 1 860 W. A second useful observation from the same work: across a 6-minute maximal test, except at the very start, force never exceeded 65–70% of that maximum — so sustained training loads sit well below the peak. General fitness writing puts typical stroke force somewhere in the 250–600 N band depending on intensity, which is consistent.
But peak athletic output is not the worst case your machine will see. The worst cases are a heavy novice yanking from a dead stop, and an athlete losing the handle so the return mechanism snaps the chain taut.
Number two: what the standard will do to your sensor
Here is where ISO 20957-7 earns its money. The clause covering ropes, belts, chains and their attachment components requires them to withstand a static load of (2 100 ± 30) N. The moment you replace the chain anchor pin with a load pin, your sensor becomes an attachment component and has to pass that test without permanent damage.
So you have two design points that are not remotely close to each other: normal use peaks around 1 350 N, and certification pushes 2 100 N through the same part. Consider what that does to three plausible capacities, assuming the common strain-gauge pattern of 150% FS safe overload and 200% FS ultimate:
| Rated capacity | Elite peak 1 350 N as % FS | 2 100 N proof load as % FS | Ultimate overload | Verdict |
|---|---|---|---|---|
| 2 000 N | 68% | 105% | 4 000 N | Survives the test but is loaded past its rated range doing it. Acceptable for Class H with a documented max user mass, uncomfortable otherwise. |
| 3 000 N | 45% | 70% | 6 000 N | The one I quote most. Proof load sits at 70% FS, athletic peak at 45% FS, and there is enormous headroom for the drop-and-snap case. |
| 5 000 N | 27% | 42% | 10 000 N | Right for Class S commercial machines and anything with a heavy awkward user population. Costs you nothing usable in resolution — see section 6. |
The 3 kN choice we made for the Dutch OEM came straight out of this table, and the reasoning was not “that looks about right”. It was: the highest load we will ever certify against is 2 100 N, I want that to sit below 80% FS so the good-stuff-at-low-percent-FS rules apply, therefore 3 000 N is the smallest honest capacity.
6. Resolution: the one specification you can stop worrying about
Every OEM I meet asks about resolution, and nearly every one has been told to buy a smaller-capacity sensor so they don’t “lose resolution”. Let’s actually run the numbers on the 3 kN pin. It is not close.
Take a 3 000 N cell with a 2.0 mV/V output on 5 V excitation:
Full-scale output = 2.0 mV/V × 5 V = 10 mV at 3 000 N
A typical 24-bit delta-sigma bridge front end with PGA gain 128 and a 2.5 V reference has a differential input range of ±(2.5 / 128) = ±19.5 mV, i.e. a 39 mV span
Real noise-free performance at 80–160 conversions/second is realistically 18 bits: 39 mV ÷ 262 144 = 0.149 μV per count
Scale factor = 3 000 N ÷ 10 000 μV = 0.30 N per μV
Resolution = 0.149 μV × 0.30 N/μV = 0.045 N
Now deliberately pessimise it. Assume a cheap front end giving only 16 noise-free bits: 39 mV ÷ 65 536 = 0.60 μV, which is 0.18 N. Against a force curve that runs from zero to 1 350 N, that is 0.013% of the signal. It is invisible. It is also roughly two hundred times smaller than the mechanical fit problem we spent a month solving in section 4.
And the “oversizing hurts” argument collapses completely when you extend the table: at 5 000 N with the same front end, resolution becomes 0.30 × (5 000 / 3 000) = 0.50 N per μV × 0.149 μV = 0.075 N. You have multiplied the capacity by 1.67× and still resolved eight-hundredths of a newton.
The reason is structural. A strain-gauge bridge is an analogue device with an essentially continuous output; its limit is noise, not quantisation, and there is a great deal of cheap silicon dedicated to removing noise. In applications where the sensor is directly digitised at high gain — which is what rowing is — resolution is bought from the ADC, not from the sensor range.
Temperature behaves the same way, which is worth saying once so nobody spends a week on it. A typical cell specifies ±0.02% FS/10 °C on both zero and output. On a 3 000 N cell that is 0.6 N per 10 °C of drift. A rower warming from a 15 °C garage to a 25 °C room shifts by well under a newton on a signal whose interesting features are hundreds of newtons tall.
7. Bandwidth: the point where your force curve starts lying
This is where I lose the most projects to bad advice, because the failure is invisible. Nobody gets an error message; the curve just isn’t quite the truth.
What the interesting part of a stroke looks like in time
At racing rates a rower settles somewhere between 28 and 36 strokes per minute; typical training is 20–28. At 30 spm the whole stroke cycle takes 2.0 seconds, and the drive phase occupies roughly a third of that — say 0.6 to 0.8 s. Within that drive, force climbs from the catch to its peak in something like 0.15 to 0.25 s, then falls away to the finish.
That rise time is the entire specification. Everything you want to know — peak force, when the peak happens, whether the drive is front-loaded or back-loaded, how smoothly force is applied at the catch — lives in the shape of a curve that develops over about 200 milliseconds.
What happens when you sample too slowly
Consider three plausible rates against those numbers:
| Sample rate | Points across the full drive (0.7 s) | Points across the rise to peak (0.2 s) | What you can honestly claim |
|---|---|---|---|
| 10 Hz | 7 | 2 | Average power per stroke, nothing else. Fine for a console that displays watts and stroke rate. Useless for a force curve. |
| 50 Hz | 35 | 10 | Rate and rhythm, roughly-correct totals. Recorded peak will read low by a percent or two depending on where samples land relative to the true peak. |
| 200 Hz | 140 | 40 | Publishable force curve. Peak value, peak timing and curve shape are all defensible. This is the standard used in published rowing biomechanics. |
Note that this is not a Nyquist argument. Nyquist would tell you 5 Hz is plenty for a 2 Hz repetition rate. The problem is that you are not trying to reconstruct a sine wave — you are trying to land a sample on the maximum of a curve that arrives and leaves in 200 ms, and every sample you miss biases the recorded peak downward.
The published research has settled this already. The 2025 neural-network study running an RP3 ergometer with instrumented feet and handle digitised at 150 Hz. The stroke-rate study using an inline load cell at the handle sampled force at 200 Hz and then applied an 8th-order Chebyshev Type II low-pass filter with a 15 Hz cut-off. On-water PowerLine systems log at 50 Hz. So the answer is already written: 150–200 Hz acquisition, about 15 Hz of filtering afterwards.
The high-frequency noise you can usefully ignore
A filter cut-off of 15 Hz tells you everything about where the information is: below 15 Hz. Everything above it is either stiction, chain slap, structure-borne transmission from the sprocket, or the machine ringing.
The most interesting of those is chain pitch engagement. As each roller or link engages the sprocket it produces a small impulsive excitation at a frequency set by chain speed divided by chain pitch. Chain speed during a hard drive reaches a few metres per second, and on-water peak handle velocity has been measured around 3.8 m/s; with a typical fine-pitch roller chain that puts link-passage frequency comfortably into the high hundreds of hertz, and even at a gentle 1 m/s of chain speed you are above 100 Hz.
Which resolves the apparent contradiction from section 2. The same mechanical phenomenon that a displacement instrument can count to measure chain travel is, for a force channel, simply out-of-band noise sitting three decades above your information signal. Nobody has to be clever about defeating it. A stiff sensing element, a 15–20 Hz filter in software, and a proper analogue anti-alias filter ahead of the ADC make it disappear.
8. Off-axis load, fit tolerance and why the pin usually wins
Rowing force is nominally uniaxial and never actually is. The handle floats, the athlete’s arms do not pull through a single plane, the chain rails slightly between sprocket and anchor, and every one of those things introduces a load component perpendicular to whatever axis you declared.
Cosine error, the first-order term
If the true force F arrives at angle θ to the sensor’s measuring axis, the sensor reports F·cos θ:
| Misalignment θ | Reading vs true force | Error on a 1 350 N peak |
|---|---|---|
| 5° | 99.6% | −5 N |
| 10° | 98.5% | −20 N |
| 15° | 96.6% | −46 N |
| 20° | 94.0% | −81 N |
Compare those with the 0.045 N resolution we computed in section 6. The installation is roughly a thousand times more important than the noise floor, and everyone budgets for the wrong one.
Why a load pin is structurally the better answer here
Three families are in contention for this machine, and they fail differently.
Shaft-pin load cells (load pins) are built on double-ended shear beam construction inside a solid stainless steel body. They are designed specifically to be indifferent to bending moments and off-centre loading, and — decisively for this application — the same machined surfaces that carry the load also define how the part is located. Fit an H7/g6 sliding fit into a reamed bore, add a keeper plate so it cannot rotate, align the load-direction marking to the actual force vector, and the off-axis problem is solved mechanically rather than computationally. It also means the sensor replaces a part you already buy, so nothing gets longer.
S-type tension/compression cells are outstandingly accurate along their axis and much less forgiving off it. In a chain path they want rod-end bearings or clevises at both ends to stay axial, and those add exactly the length you do not have. Their natural victory conditions are test benches, hoppers and fixtures — places with room. Where they do win in a rower is a short inline retrofit where rubber-mounted cabins already exist, or the lab situation in section 10.
Flat type tension cells solve a different problem entirely: a low-profile body that bolts to a bulkhead or backing plate rather than hanging in a load path. They trade some accuracy for that geometry — typical figures run around 0.1% FS comprehensive rather than 0.02% — which against bicycle-grade misalignment is still two decimal places of margin.
9. The failure nobody budgets for: three million load cycles a year
Here is the conversation I now have with every rowing OEM, and it is the one that most often changes the order.
A rowing machine does not weigh anything. It cycles. Every stroke takes the sensor from essentially zero to most of its working range and back. Let’s count for real, at a realistic 28 strokes per minute:
Home machine, 30 min/day: 28 spm × 30 min = 840 cycles/day → about 307 000 per year
Boutique studio / commercial, 6 h/day: 28 spm × 360 min = 10 080 cycles/day → about 3.2 million per year over 320 operating days
Over a 5-year service life: roughly 1.5 million cycles at home, 16 million in a studio
Strain-gauge load cells are commonly quoted as rated for a million or more load cycles, but that headline figure assumes a modest stress amplitude. Rowing is close to the worst case a transducer can be asked to survive: a pulsating cycle from near zero up to 45–70% of full scale, once per second, indefinitely. Fatigue life in metals falls away logarithmically with stress amplitude, which means that reducing the working percentage of full scale buys far more life than it costs you in anything else.
And since section 6 proved that resolution costs nothing, this becomes the deciding argument. Choosing 3 kN over 2 kN moves your athletic peak from 68% to 45% of full scale. Choosing 5 kN over 3 kN for a commercial machine moves it to 27%. You give up resolution you cannot use and you buy fatigue life you very much can.
Mini-case: the gym rollout that drifted in eight months
In 2025 I got an email from a distributor looking after a chain of studios. Their rowers — and this was the interesting part — had started reporting inconsistent wattages between units after roughly eight months, always in the same direction, always downwards. My first guess, a genuine zero shift from overload, turned out to be right but for the wrong reason. Nobody had dropped anything. The machines simply cycled every stroke at close to the top of their sensor’s capacity, day in and day out, and micro-damage accumulated.
The retrofit was unglamorous: re-specify at roughly double the capacity, add a mechanical stop so the return mechanism could not spike the pin beyond a known limit, and teach the service team to re-zero and check against a reference load every quarter. But the lesson generalised, and it is the reason I now lead with cycle count rather than capacity.
10. The eight questions I ask before I quote a rowing machine sensor
This is the practical core of the article, and it is also the honest answer to why I rarely quote a rowing machine out of a catalogue.
A load pin is a custom part by definition. It exists to replace a pin, shaft or bolt that your machine already had, and every machine is different. Even the standard cells below are starting points for an envelope — diameter, length, capacity, thread or shoulder detail, cable exit, and where the strain gauges need to sit relative to your load entry — not finished answers. If a supplier quotes you a pin from stock for a rowing machine without asking these eight things, they have quoted you a pin, not a force measurement.
- What existing part does the sensor replace? Send the drawing. I need nominal diameter and length, the shoulder or circlip details, and the material you are replacing — because I have to match or beat its stiffness, not just its outline.
- What is the bore tolerance, and what can you actually hold? I ask for a sliding fit along the lines of H7/g6. In the Dutch case the whole 2.8% error came from a bore nobody had dimensioned tightly.
- Which way is the load, and where must the load-direction marking point? Every pin ships with a marking aligned to its shear axis. If your assembly worker cannot see it, it will be fitted wrong.
- How do you stop it rotating? A keeper plate, a flat, a keyway or a clamp — pick one and draw it. Rotation destroys internal wiring and rotates the shear axis away from the load.
- Where can the cable exit, and how much room does it have? This is the question I most often have to ask twice. The cable route decides the field reliability more than any other single detail.
- What is the abuse case? Rated working load matters less than the worst thing a user can do: dropping the handle, sitting on the frame, a certification proof test at 2 100 N. Give me the worst case and I will size to it.
- What does it have to survive environmentally? Sweat evaporates to salt; garages get cold and damp; studios get hosed. IP65 is the normal answer and IP68 is not expensive when the part is already sealed.
- What is downstream — and how many channels? mV/V into your own strain-gauge ADC, an amplified 0–10 V or 4–20 mA feed, or RS485 straight off the pin. And how many per machine: three quick cells for a handle line, or two matched cells if you are measuring left/right asymmetry at the stretcher.
Then there is one question I ask myself, which I have learned to say out loud: do you actually need us for this part? Which brings me to the most useful conversation I had last year.
Case 2: the sports university where I talked myself out of half the order
A university sports-science department was instrumenting an existing dynamic rower for a study. They wanted handle force and stretcher force, they wanted it synchronised with kinematics, and they had a budget.
I quoted the handle channel. For the stretcher I told them to buy a force plate from someone else — a three-component plate designed for exactly that job, with its own calibration infrastructure and support, because a load-cell-and-bracket assembly I invented for them would have been worse in every way that mattered to a publication. I also told them plainly that their data acquisition should come from their usual supplier, because we do not build integrating loggers and pretending otherwise would have wasted their semester.
What we supplied was narrow and, I think, genuinely good: one inline force sensor in the handle-to-cord path, specified to their sampling requirement, built with the cable length they needed, calibrated per unit across five test points with the record included, wired to a diagram drawn for their specific connector, and delivered with an honest statement that our figures describe the sensor and not their complete measurement chain.
11. Where the sensing layer ends and the machine builder takes over
I have now made this argument in enough projects to write it down once, precisely.
| What we supply and specify | What stays with you, the machine builder |
|---|---|
| Load pins, S-type tension/compression cells, flat type tension cells and the machined variants of each | The rowing machine, its frame and its resistance system |
| The mounting envelope, fit tolerance and load-direction marking | The housing boring, the keeper plate and the assembly process control |
| Transmitters and amplifiers giving 4–20 mA, 0–10 V or isolated RS485 Modbus RTU | The strain-gauge ADC if you need a real force curve, and all filtering decisions |
| Indicators, junction boxes and per-unit calibration records with wiring diagrams | The power algorithm, the calorie model, the display firmware and the app |
| Component-level specification data: capacity, output, creep, hysteresis, IP rating, temperature coefficients | Conformity of the finished machine to ISO 20957-1 and ISO 20957-7, including the power-readout accuracy test added in the 2024 edition |
| Advice on what our part cannot do | Bluetooth FTMS integration — Fitness Machine Service 0x1826 with the Rower Data characteristic 0x2AD1 — and app ecosystem compatibility |
Two things in that right-hand column deserve stress.
The certification belongs to you. A rowing machine placed on the EU or UK market has to satisfy the safety requirements of ISO 20957-1 together with the rowing-specific requirements of ISO 20957-7, and — where the machine displays training data — the accuracy classes A, B and C defined there. A strain-gauge load cell is not a certified component under either ISO 20957-1 or ISO 20957-7, and owning a calibration certificate does not make it one. We can give you a traceable calibration record and honest specification data to feed into your technical file; we cannot give you a compliance claim, and we will not say we can.
Nor is it a safety-rated device. Load cells in machinery are occasionally asked to participate in overload protection. A general-purpose foil-gauge transducer has no diagnostics, no redundant channel and no defined failure mode, so it is not suitable as the sole element of a safety function. That is a machine-level design decision for your risk assessment, exactly as it would be for a robot cell under ISO 10218 or a lifting application.
Everything else in this article — where to put the sensor, how big to make it, how fast to read it, what tolerance to hold the bore to — is where we can genuinely help, because it is the same problem we solve for weighbridges, hoppers and test benches, just shaped like a rowing machine. We covered the neighbouring applications in similar depth for smart fitness equipment, rehabilitation and strength testing equipment, and smart climbing walls and hangboards.
12. Recommended force sensors for rowing machines
Four products cover the great majority of rowing enquiries I get, and they are ordered by how I actually quote them. Read this section with one sentence in mind: on this application the catalogue part is the starting point for a drawing, not the answer. Every one of the first three is regularly machined to a customer’s envelope.
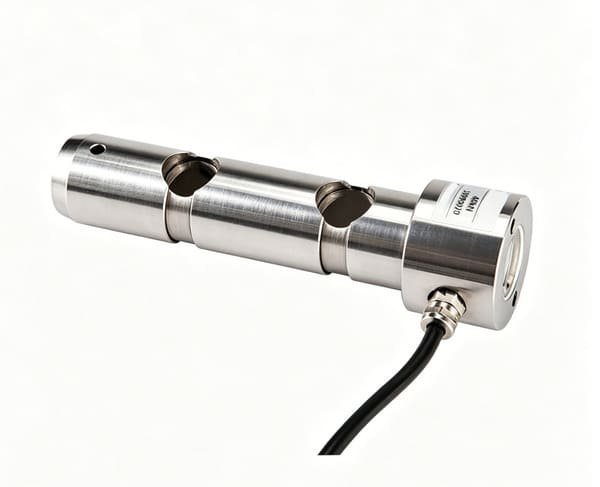
WST701 — Custom Size Shaft-Pin Load Cell (Load Pin)
The part I reach for first, and the headline recommendation for this article. It replaces a pin, shaft or bolt that your rower already has, so it adds no length, no bracket and almost no weight to the load path.
- Why it suits a rower: double-ended shear beam construction in high-strength stainless steel, genuinely tolerant of bending and off-centre loading
- Customised as standard: length, diameter and load capacity all to your drawing; this is a machined part, not a stock size
- Accuracy: typically within ±0.5% FS, with options considerably better where the budget allows
- Output: mV/V four-wire as standard (nominal 1–2 mV/V); integrated 4–20 mA or RS485 versions available if you don’t want your own front end
- Environment: IP68 sealing options — worth having even indoors, because dried sweat is salt
- Fit: specify H7/g6 on the bore and fit an anti-rotation keeper plate; both are mandatory, not optional
- Calibration: factory NIST-traceable certificate plus a mandatory in-situ calibration in your own housing, at 3–5 test points
Best for: a chain anchor pin, axle or structural bolt anywhere in the frame-end load path — which is where we put it in the Dutch case in section 4. If your machine already has a pin carrying that load, start here and send me the drawing.
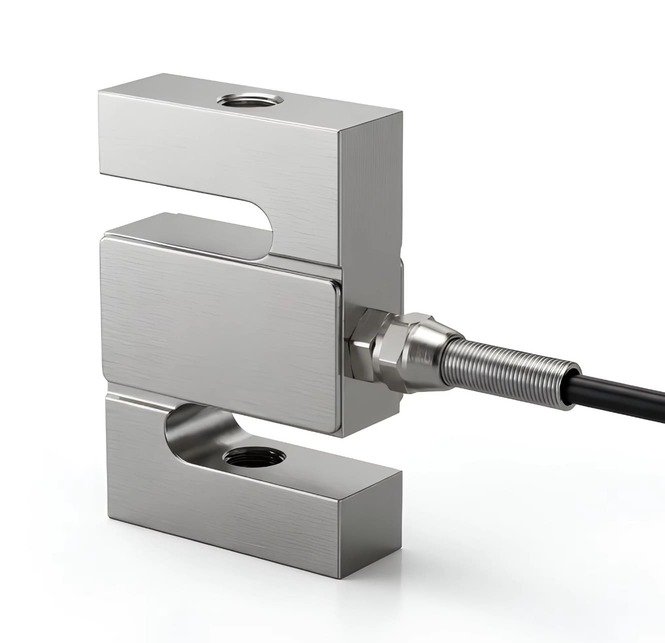
WST401 — S-Type Tension / Compression Cell
The accuracy champion of the three, when there is room for it. Choose it for test rigs, lab retrofits and any short inline path where you can keep the load on-axis with proper rod ends.
- Range: 0.05–200 kN family; typical rowing selections sit well down that list
- Accuracy: ±0.02–0.05% FS comprehensive error, creep ±0.02% FS/30 min
- Output: 2.0 mV/V, recommended excitation 10 VDC
- Overload: 150% FS safe, 200% FS ultimate
- Bridge: input 380 ± 10 Ω, output 350 ± 3 Ω, four-wire shielded cable
- Environment: IP65, −20 to +65 °C operating, temp effect ±0.02% FS/10 °C on zero and span
Best for: the university retrofit described in section 10, test fixtures, validation rigs used to check your own production units, and inline handle measurement where both ends can be properly articulating joints. Not my first choice when there is no spare length in the chain path.
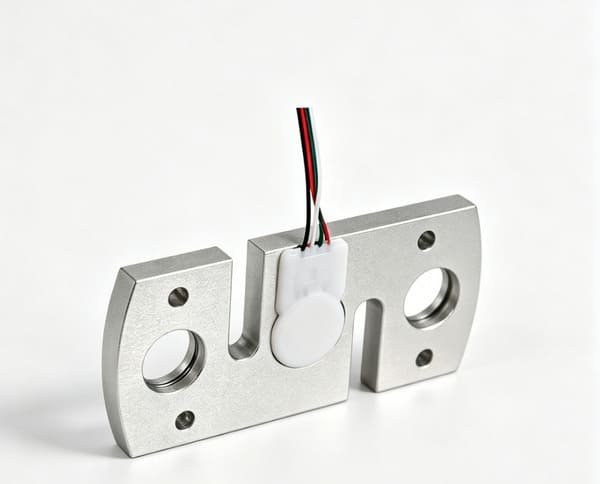
WST408 — Flat Type Tension Cell for Smart Fitness Equipment
A low-profile body that bolts to a bulkhead or backing plate instead of hanging in the load path. Picked when the rower’s industrial design simply has no room for anything else, and it is built customised by default.
- Range: 100–300 kg family, accuracy class G1
- Customised: size, capacity and structure are all quoted to your request — this unit rarely ships in a stock form
- Accuracy: 0.1% FS comprehensive, linearity, repeatability and hysteresis
- Output: 1.5 ± 0.2 mV/V at 3–10 VDC excitation
- Bridge: input and output 1000 ± 10 Ω — a high-impedance bridge drawing less excitation current, which matters on battery-powered rowers
- Environment: IP65, aluminium alloy, −20 to +60 °C, compensated −10 to +40 °C
- Note: zero balance is ±3.0% FS, so plan to tare in software at boot — a normal and entirely manageable design step
Best for: tight industrial-design envelopes where the sensor must lie flat against a plate rather than sit inline, and for budget-sensitive connected rowers where 0.1% FS is comfortably above every other error source on the machine.

WST1508 — Load Cell Amplifier / Transmitter
The signal-chain option for OEMs who do not want to design their own bridge front end. Sigma-delta conversion, industrial analogue outputs, and Modbus for anything that needs to talk to a controller.
- Outputs: 0–20 mA / 4–20 mA current, 0–10 V / 2–10 V voltage, plus isolated RS485 Modbus RTU
- Conversion: sigma-delta A/D, resolution better than 1/1 000 000
- Speed: 10 or 80 conversions per second — selectable
- Excitation: Uexc = 5 V, drives up to 12 × 350 Ω cells
- Integration: two isolated digital inputs; 105 × 72 × 27 mm housing; DC 18–35 V supply
- Environment: −10 to +40 °C operating, 85% RH non-condensing
Use it correctly: at 80 conversions/second this is right for average power, stroke rate and distance — the numbers a console displays. It is not fast enough for a publishable force curve. For that, put a strain-gauge ADC at 160–320 sps on your own board (see section 7) and take one of the mV/V sensors above instead.
The wider catalogue fills in the corners: see the S-type load cell range, the customised load cell range and the micro load cell range. If you are instrumenting more than one point on the machine — left and right stretcher, or handle plus seat — ask about matched pairs; buying two cells matched in output sensitivity saves an afternoon of corner trimming every time.
13. FAQ
What kind of load cell does a rowing machine use?
Most production rowing machines use no load cell at all: they infer power from how the flywheel decelerates between strokes. Machines that do measure force directly fall into three camps. A shaft-pin load cell, or load pin, replacing an existing pin or bolt in the chain anchor or axle — the most common production solution, because it adds no length and deals well with off-axis loads. An S-type tension/compression cell clamped inline in the chain or cord, either in the handle or at the frame end — very accurate, but it needs room and articulation. Or a flat type tension cell bolted to a bulkhead when the industrial design has no room for anything else. Handle force and foot-stretcher force are the two channels worth instrumenting.
Do I need a multi-axis or six-axis force sensor on a rowing machine?
Almost never. Along the chain path the useful information is a single force component along one known axis, and a pin is better than a multi-axis body precisely because it is insensitive to everything else. The exception is the foot stretcher: published rowing research that separates leg drive from handle force uses multi-component force plates under the stretcher, and left/right asymmetry genuinely needs multiple channels. Even there, two single-axis cells or a purpose-built plate is usually more economical than a six-axis sensor.
Should I measure force at the handle or at the frame end?
It depends on what number you are defending. Measuring at the handle excludes all drivetrain friction, so readings are comparable between machines and even between brands — which is exactly why aftermarket power meters such as SmartRow are handle-mounted. The cost is a cable that flexes every stroke and a load angle that changes through the drive. Measuring at the fixed frame end has stable geometry and no moving cable, but it includes bearing and sprocket losses, which are stable enough to calibrate out once and slow enough to require periodic re-verification. For a production rower I recommend the frame end; for an accessory whose selling point is cross-brand comparability, the handle.
What capacity should I choose for a rowing machine load cell?
Start from two numbers rather than from intuition. Published measurements of world-class rowers put peak handle force at around 1 350 N for men and 1 020 N for women, with sustained 6-minute output well below that. The relevant standard, ISO 20957-7, requires ropes, belts, chains and their attachment components to withstand a static load of (2 100 ± 30) N — and a load pin replacing an anchor pin is an attachment component. With a common 150% FS safe overload and 200% FS ultimate, a 3 000 N cell puts the athletic peak at 45% FS and the proof load at 70% FS, which is the figure I quote most. Around 5 000 N suits Class S commercial machines.
Does choosing a larger capacity reduce measurement resolution?
Technically yes, but not by anything you can measure in this application. A 3 000 N cell at 2.0 mV/V on 5 V gives a 10 mV full-scale output; feeding that into a typical 24-bit bridge front end with about 18 noise-free bits over a ±19.5 mV input range resolves roughly 0.045 N, and a pessimistic 16-bit figure still gives about 0.18 N. Against a force curve spanning 0–1 350 N that is 0.013% of the signal — and hundreds of times smaller than the error a badly toleranced bore introduces. Choose capacity for overload margin and fatigue life, and buy resolution from your ADC.
What sampling rate do I need for a rowing force curve?
Aim for 150–200 Hz, which is what published rowing biomechanics uses: instrumented ergometer work has been recorded at 150 Hz and handle-force studies with an inline load cell at 200 Hz, followed by a low-pass filter around 15 Hz. At 30 strokes per minute the drive phase lasts about 0.6–0.8 s and force climbs to its peak in roughly 0.2 s, so a 10 Hz transmitter captures the drive with about seven points and will noticeably misreport the peak. A 50 Hz system handles totals reasonably but biases the recorded peak low. Below about 15 Hz of subsequent filtering, you have already removed the information.
Should the sensor output mV/V, 0–10 V, 4–20 mA or RS485?
Use whichever matches what you already have, with one hard rule. If you want a real force curve, take mV/V and put a strain-gauge ADC at 160–320 samples per second on your own control board — no general-purpose averaging transmitter is fast enough, including ours, which runs at 10 or 80 conversions per second. If you only need average power per stroke, stroke rate and distance, then an amplified output saves you analogue design: 0–10 V is easy to feed into any MCU ADC, 4–20 mA survives longer cable runs and noisy environments, and isolated RS485 Modbus RTU is the right answer when the sensor has to talk to a controller rather than a board.
Can you make a load pin to our drawing, and what do you need to quote it?
Yes, and it is how most of these orders are built — a load pin exists to replace a part you already have, so it is custom by definition. I ask eight things: the drawing of the existing pin with its dimensions and shoulder or circlip details; the bore tolerance you can actually hold, ideally a sliding fit around H7/g6; the load direction and where the load-direction marking should point; the anti-rotation arrangement; where the cable can exit and how much room it has; the worst-case abuse load including any certification proof test; the environmental requirement, usually IP65 or IP68; and what the sensor feeds into, plus how many channels per machine. The most common omission is the cable exit, which is also the most common cause of field failures.
Does fitting your sensor make my rowing machine compliant with ISO 20957-7?
No. ISO 20957-7 specifies safety requirements and test methods for rowing equipment, including the accuracy classes A, B and C applied where training data are displayed, and conformity to it belongs to the machine manufacturer. A strain-gauge load cell is not a certified component under ISO 20957-1 or ISO 20957-7, and holding a calibration certificate does not change that. It is also not a safety-rated device and should not be the sole element of a safety function. What we can supply is the transducer machined to your envelope, honest specification data for your technical file, and a traceable per-unit calibration record — not the compliance claim.
Send me the pin drawing, not the datasheet
Four numbers size almost every rowing machine sensor: your peak expected handle force, the worst-case abuse or certification load such as the 2 100 N chain-component proof test, the diameter and available length of the pin or bolt the sensor can replace, and whether you need a publishable force curve or only average power. Give me those — a marked-up photo of the existing pin is plenty — and I will come back with a machined envelope, a capacity recommendation with the overload arithmetic shown, and the questions I still need answered.
We supply the sensing layer: load pins, load cells, force sensors, transmitters, junction boxes and indicators. Custom sizes are the normal case here, and trial orders are welcome.
Get a rowing machine sensor sized to your drawing →
Email Robin directly
VektorForce · Load cells, load pins, force sensors, junction boxes, transmitters & indicators · www.vektorforce.com